•
1 min read
How to Read a Liquid Fund Factsheet
Most people pick a liquid fund the way they pick a movie: star rating, a quick scroll, done. But a liquid fund is where your spending money lives. Next month's rent, the Goa trip in March, the phone you've promised yourself. Before you park it anywhere, spend ten minutes with the one document that tells you exactly what that fund owns, how long it owns it for, and what it charges you.
That document is the liquid fund factsheet. It looks intimidating the first time: grids, acronyms, decimals to four places. It isn't. This guide walks you through a factsheet panel by panel, in the order the panels usually appear on the page, so that by the end you can open any liquid fund's factsheet and read it end to end without Googling a single term.
What a liquid fund factsheet is, who publishes it, and where to find the latest one
A factsheet is a monthly disclosure published by the Asset Management Company (AMC) that runs the scheme. Every fund house publishes one, usually a single PDF covering all its schemes, with one page (sometimes half a page) per fund. It is dated as of the last day of the month and typically goes live in the first two weeks of the following month.
Where to look:
The AMC's own website, under a "Downloads", "Factsheet" or "Fund Documents" section. This is the primary source and always the most current.
The AMFI website, which aggregates industry-level data, scheme classifications and NAV history across fund houses.
The monthly and fortnightly portfolio disclosures, which are separate from the factsheet. Debt schemes, including liquid funds, disclose their full portfolio holdings twice a month, usually as of the 15th and the last day of the month. The factsheet gives you the monthly summary with commentary and ratios.
Rule of thumb: use the factsheet to understand the fund's shape, and the fortnightly portfolio disclosure when you want to see every single security it holds, line by line.
Before page 1: what a liquid fund actually is, in plain English
A liquid mutual fund is a pooled investment that lends money for very short periods, often a few days to a few weeks, to the government, to banks, and to large, well-rated companies. It earns interest on that lending, and that interest, minus costs, becomes your return. There is no lock-in. Redemption proceeds typically reach your bank account within one working day, with an instant redemption facility available on many schemes up to regulatory limits.
One SEBI rule shapes almost every number you're about to read: a liquid fund can only hold debt and money market instruments with a residual maturity of up to 91 days. Residual maturity means time left until the borrower repays. So no matter what a liquid fund buys, everything in the portfolio must mature within roughly three months.
That single constraint is why liquid funds behave the way they do: low volatility, low interest-rate sensitivity, high liquidity. They are low-risk, not risk-free, and returns vary with market conditions. When you see "average maturity: 38 days" on a factsheet, you're seeing that rule in action.
Panel 1 — Scheme basics: inception, manager, category, benchmark

The top block is the fund's ID card.
Inception date tells you how long the scheme has existed. A liquid fund that has run through multiple rate cycles and at least one credit stress episode has a more meaningful track record than one launched last year.
Fund manager and tenure tells you who is making the calls and since when. Debt funds are far more process-driven than star-driven, but manager churn is still worth noting.
Category should read Liquid Fund under SEBI's scheme categorisation. If it says Ultra Short Duration, Money Market or Overnight, you are reading a different animal with different maturity limits.
Benchmark is usually a NIFTY Liquid Index (often the Tier 1 variant, sometimes labelled A-I). This matters. The fund is benchmarked against a basket of short-term money market instruments, not against a fixed deposit rate or a savings account rate. A factsheet will never promise you "better than FD". It will show you performance against an index of similar instruments. Any comparison to bank products is something you do yourself, with the understanding that one is market-linked and the other is contractual.
Panel 2 — AUM and AAUM: what fund size does and doesn't tell you
You'll see two numbers: AUM (assets under management, month-end) and AAUM (average AUM over the month).
Size helps in a few practical ways. A larger liquid fund can usually meet a big redemption without being forced to sell securities at bad prices, and it can spread costs across a bigger base. A very small fund is more exposed to a single large investor walking out.
Here's what size does not tell you: safety. A large fund holding weaker credit is riskier than a small fund holding only treasury bills. Read AUM as a liquidity signal, then go look at the holdings for the actual risk. Compare AUM to AAUM too. A big gap suggests lumpy institutional flows in or out during the month.
Panel 3 — Maturity and duration: four numbers, four analogies
This block trips up first-timers. Take them one at a time.
Average maturity: the weighted average time until the fund's holdings repay. Think of it as the average due date of all the IOUs the fund is holding. For liquid funds this typically sits between roughly 20 and 60 days.
Macaulay duration: the average time it takes to get your money back, counting interest payments along the way. Imagine repaying a friend in instalments. Macaulay duration is the average moment your friend is made whole.
Modified duration: how much the fund's value moves if interest rates move. A modified duration of 0.10 years roughly implies a 0.10% price move for a 1% rate change. It's the fund's shock absorber rating, and for liquid funds it is deliberately tiny.
Yield to Maturity (YTM): the annualised yield the current portfolio would earn if every holding were held to maturity and nothing defaulted. It is an indication, not a promise. Your actual return will be YTM minus the expense ratio, adjusted for whatever the fund reinvests into as securities mature.
A useful sanity check: if one liquid fund's YTM is noticeably higher than its peers', ask why. Higher yield in the same maturity bucket usually means slightly lower-rated paper.
Panel 4 — The holdings table, decoded
This is the most informative panel and the one people skim. Common line items:
Treasury Bills (T-Bills): short-term borrowing by the Government of India. The lowest credit risk instrument available in rupees.
TREPS / Repo / Reverse Repo: overnight, collateral-backed lending in the money market. Effectively the fund's cash drawer. Extremely short, extremely liquid, usually lower yielding.
Certificates of Deposit (CDs): short-term deposits issued by banks.
Commercial Paper (CP): unsecured short-term borrowing by corporates. Higher yield, and the line item where credit judgment matters most. Look at who the issuers are, not just the percentage.
Cash and net receivables: settlement balances and margin money.
Two things to check: issuer concentration (how much sits with any single company or group) and the split between sovereign/quasi-sovereign paper and corporate paper. A portfolio that is heavily T-Bill and TREPS is more conservative than one leaning on corporate CPs, and it will usually show a slightly lower YTM as a result. Neither is wrong. You should just know which one you own.
Panel 5 — Rating profile and the 20% liquid assets rule
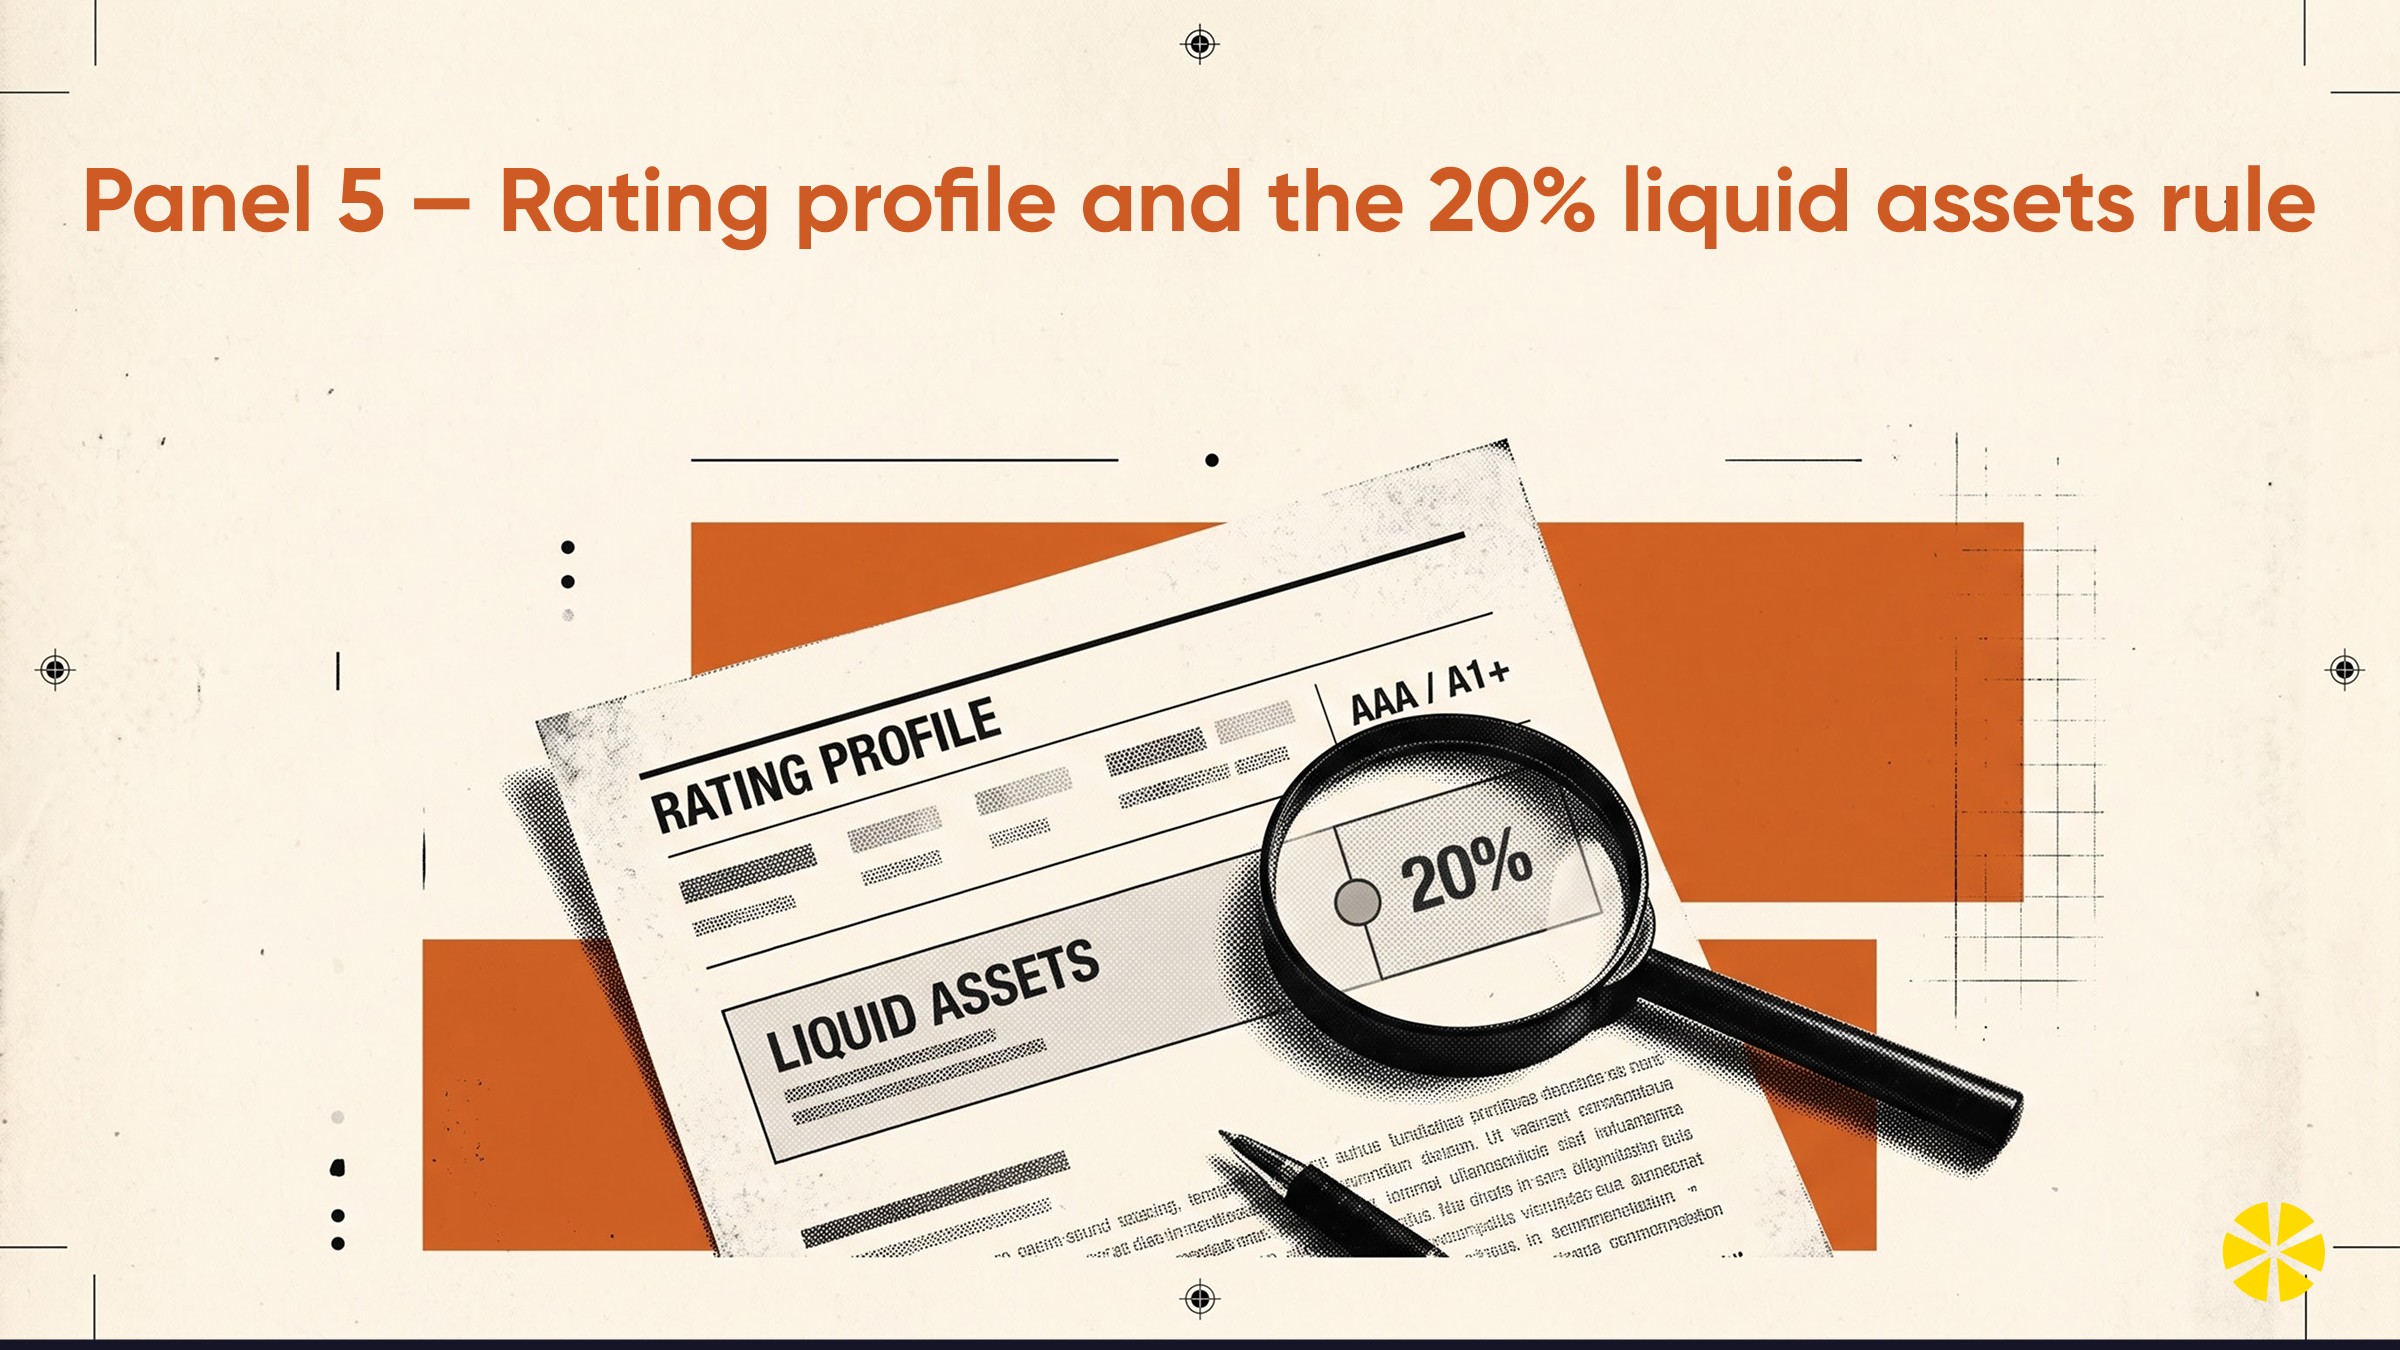
Next to the holdings you'll find a ratings pie or bar chart, typically showing:
SOV: sovereign, meaning government-backed.
A1+: the highest short-term credit rating assigned by rating agencies. Most liquid fund corporate holdings sit here.
Cash and equivalents: TREPS, repo, and settlement balances.
Post-2019, after industry-wide stress in short-term debt, SEBI tightened the rules. Liquid funds must hold at least 20% of their assets in liquid assets: cash, government securities, T-bills and repo on government securities. They also cannot hold structured obligations or credit-enhanced paper in the same way, and they carry a graded exit load for very short holding periods. When you see a chunky sovereign and cash slice on a modern liquid fund factsheet, that regulation is why.
Panel 6 — Risk-o-meter and the PRC matrix
Every scheme document carries a Risk-o-meter, a speedometer-style dial that usually reads Low to Moderate for liquid funds. It's a headline, not an analysis.
The more useful disclosure sits beside it: the Potential Risk Class (PRC) matrix, a three-by-three grid. Columns represent interest rate risk (Class I to III, relatively low to relatively high) and rows represent credit risk (Class A to C). Most liquid funds sit in the A-I cell, meaning relatively low credit risk and relatively low interest rate risk. That cell is the fund's self-declared ceiling. It commits not to exceed those risk levels.
Read the grid, not the colour. A fund positioned at B-I is telling you it may take more credit risk than an A-I fund, even though both dials might look similar.
Panel 7 — Expense ratio: why 10 to 30 basis points is a big number here
The factsheet lists two expense ratios: one for the regular plan (which includes distributor commission) and one for the direct plan (which doesn't).
In equity funds, a 0.5% difference in cost gets lost in the noise of market movement. In liquid funds, it doesn't. If the portfolio's gross yield is roughly 6 to 7%, then 25 basis points of cost is a meaningful slice of the return you actually keep. This is why liquid fund expense ratios are among the lowest in the industry, often in the 0.10% to 0.35% range, and why the direct-versus-regular gap deserves a look rather than a shrug.
Cost is also the most predictable variable on the entire page. Yields move. Expenses mostly don't.
Panel 8 — Load structure, cut-off timings and NAV applicability
Liquid funds have no entry load, and since 2019 they carry a graded exit load for redemptions within seven days of investment. It steps down day by day, highest on day one, tapering to zero from day seven onwards. The exact table is printed on the factsheet. The amounts are small fractions of a percent, but they exist to discourage ultra-short parking that disrupts the portfolio.
Then there is the part unique to liquid funds: NAV applicability. For liquid and overnight funds, you generally get the previous day's NAV if your application and cleared funds reach the AMC before the applicable cut-off (typically 1:30 PM for purchases). Miss it, and you get the next applicable NAV. For redemptions, the cut-off is usually 3:00 PM.
The phrase that matters most is cleared funds. Your money must actually be received, not merely initiated. This is why a transfer sent at 1:25 PM might still land you the next day's NAV.
Panel 9 — The performance table, read the liquid-fund way
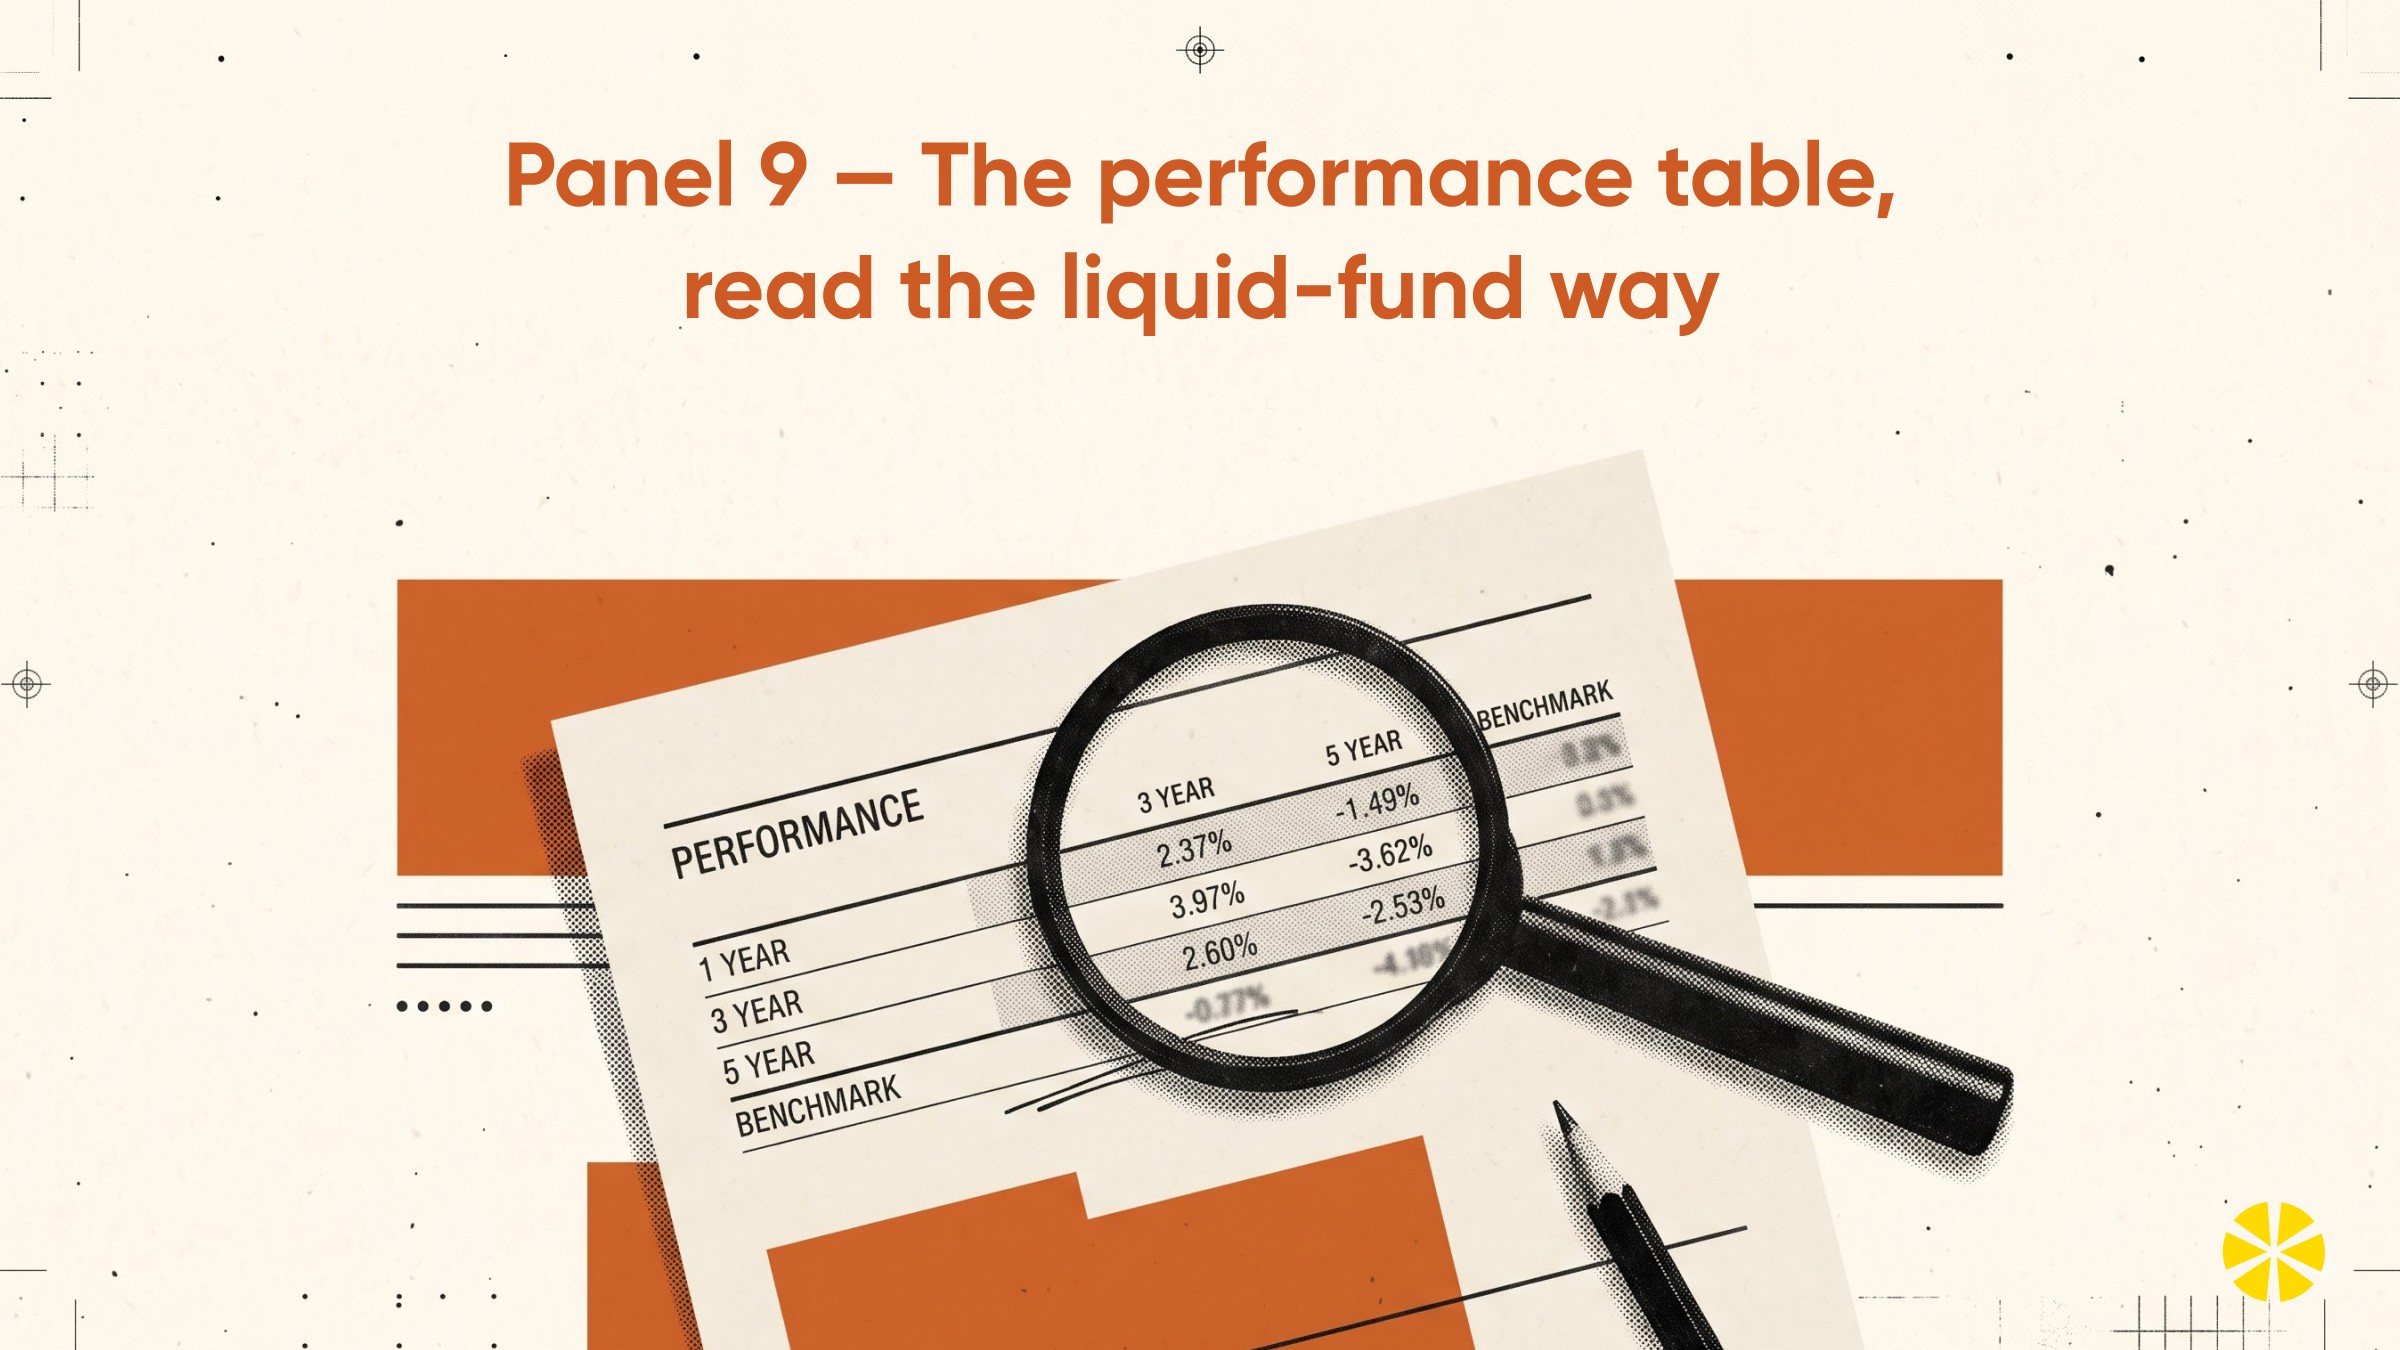
Most performance tables lead with 1-year, 3-year and 5-year returns. For a liquid fund, scroll to the 7-day, 15-day, 30-day and 3-month columns first.
Why? Because you may hold this fund for 40 days. A 3-year annualised number blends rate cycles you weren't invested through. The short-horizon columns tell you how the fund performed in conditions closest to your actual holding period, and, crucially, how consistently it tracked its benchmark and category.
Check the returns since inception and the benchmark column beside every period as well. A fund that beats its benchmark by a hair, consistently, in a low-volatility category is doing its job. A fund that swings wildly above and below it is doing something you should understand before investing.
Remember: past performance does not indicate future returns. Debt fund returns move with prevailing money market rates, which change with RBI policy and liquidity conditions.
The fine print most people skip
Buried at the back of the factsheet or in the scheme documents:
Swing pricing: a mechanism that adjusts NAV during severe market dislocation so that exiting investors bear the cost of their own exit, rather than passing it to those who stay.
Segregated portfolios (side-pocketing): the ability to ring-fence a defaulted or downgraded security so the rest of the portfolio stays clean and tradeable. The factsheet discloses whether a scheme has ever created one.
Stress test disclosures: periodic disclosures on how quickly a portfolio could be liquidated under stressed conditions.
Unitholder concentration: how much of the fund is held by its top investors. A liquid fund dominated by a handful of large corporate treasuries can see sharp AUM swings.
None of these is a red flag by itself. All of them are context.
What actually happens to your money after you invest
Here's the journey, mapped back to the fields you just read:
Day 0, before cut-off: your money reaches the AMC as cleared funds. You are allotted units at the applicable NAV (Panel 8).
Day 0 onward: your money joins the pool that has already lent to the government, banks and corporates listed in the holdings table (Panel 4).
Every day: interest accrues. NAV inches up. There is no dividend needed for you to earn; the gain shows up in unit value.
Continuously: as securities mature, the fund reinvests at prevailing rates. This is why YTM (Panel 3) is a snapshot, not a lock.
Day of redemption: you place a request before the cut-off, units are sold at the applicable NAV, and money is credited to your bank account, typically the next working day. If it's within seven days, the graded exit load applies.
Tax time: gains from mutual funds, including debt funds, are taxable. Rules depend on when you invested and your own tax situation, so check the current position or speak to a tax professional. Nothing here is individualised tax advice.
Units are issued in your name by the AMC. That's true whether you invest directly or through a distributor or advisory platform.
Do liquid funds ever lose value?
Yes, occasionally, and usually briefly. This is the honest answer, and the factsheet is where you look for the reasons.
Two things can push a liquid fund's NAV down on a given day. The first is a sharp move in short-term interest rates, which the modified duration figure tells you the fund is only mildly exposed to. The second is a credit event, a holding downgraded or defaulting, which is why the ratings profile and issuer concentration matter more than the headline yield.
What a factsheet can warn you about: portfolio composition, maturity profile, credit quality, cost, concentration, and past behaviour. What it structurally cannot do: predict a sudden downgrade, forecast an RBI move, or guarantee your return. No investment is zero-risk. Liquid funds are designed for low volatility and low risk, not for certainty, returns vary with market conditions, and they are not bank deposits. They aren't insured like one.
Read that way, the factsheet stops being a report card and becomes what it actually is: a disclosure of what you're taking on.
Your reusable 10-minute factsheet checklist
Twelve fields, in reading order. Screenshot this.
Category confirmation: does it actually say Liquid Fund?
Inception date and fund manager tenure: how long has this been running, and under whom?
Benchmark: a NIFTY Liquid Index, not a deposit rate.
AUM and AAUM: size, and whether the month saw big swings.
Average maturity: comfortably inside the 91-day ceiling?
Modified duration: small enough for the low-volatility behaviour you expect?
YTM: reasonable versus peers, and not an outlier on the high side?
Holdings mix: split between sovereign/cash and corporate paper.
Rating profile: share in SOV, A1+, cash and equivalents.
PRC matrix cell: ideally A-I for a conservative liquid fund.
Expense ratio: direct versus regular, in basis points.
Exit load table and cut-off timings: especially the seven-day graded load.
If all twelve read sensibly, you've done more due diligence than most retail investors ever do on short-term money.
If you'd rather park spending money than pick funds

Reading factsheets is a genuinely useful skill. But maybe you don't want to become a debt fund analyst. Maybe you just want next month's spending money to earn something instead of sitting idle in a savings account. That's the layer Multipl handles.
Multipl calls it Spendvesting: putting the money you've already set aside for future spends into mutual funds so it grows until the day you actually spend it. The Higher-Yield Spending Account is a mutual-fund-powered spending account, not a bank savings account or a bank deposit, and not insured like one. It runs on expert-selected liquid mutual funds, aiming for up to 7%*, a figure based on historical liquid-fund performance that is category-dependent and neither fixed nor assured, versus the 2 to 3.5% a savings account typically pays. The fund selection, maturity checks, credit quality screens and cost comparisons, all twelve fields above, are done by an investment team of CAs, CFAs and IIM MBAs, with no bias toward any fund house.
The practical bits: your money stays liquid and spend-ready with no lock-in, mutual fund units are issued in your name by the AMC, withdrawals go back to your bank whenever you want, and payments are secured via Razorpay and bank-grade encryption. For dated goals three to twelve months out, a trip, school fees, a wedding contribution, Planned Spends uses liquid and hybrid funds, with historical, category-dependent returns of roughly 7 to 15%*. And 70 to 100+ partner brands offer redeemable discounts of around 2 to 20% when you redeem a goal, offers tied to your goals, not guaranteed cashback on every spend. All of it is designed to fund real spends without EMIs or credit card debt, at a pace you choose.
Multipl is operated by Multipl Wealth Management Private Limited, a SEBI-Registered Investment Adviser (INA200014681) and AMFI-Registered mutual fund distributor (ARN-319633), with 5 lakh+ Spendvesters and roughly a million app downloads.
None of that changes the underlying truth of the factsheet. Returns are historical and market-linked, not guaranteed, and no investment is zero-risk. It just means someone else reads the document first.
A note on reading scheme documents responsibly
A factsheet is a summary. The full picture lives in the Scheme Information Document (SID), the Key Information Memorandum (KIM) and the Statement of Additional Information (SAI), where investment objectives, risk factors, borrowing limits, valuation policy and load structures are laid out in full. Read them before investing, particularly the risk factors section.
Mutual fund investments are subject to market risks. Read all scheme-related documents carefully. Past performance does not indicate future returns. The up to 7%* figure referenced above is based on historical liquid-fund performance and is neither fixed nor assured. SEBI registration and NISM certification do not guarantee performance or assure returns. No investment is zero-risk; liquid funds are low-risk and low-volatility, not risk-free, and returns vary with market conditions. Nothing here is individualised investment or tax advice.
FAQs
How often is a liquid fund factsheet updated?
Factsheets are published monthly, with data as of the last day of the month, and typically go live within the first two weeks of the following month. Separately, debt schemes including liquid funds disclose their complete portfolio holdings twice a month, usually as of the 15th and month-end. If you want the freshest view of what a fund owns, use the fortnightly portfolio disclosure rather than the factsheet.
What's a good average maturity for a liquid fund?
Most liquid funds run an average maturity in the range of roughly 20 to 60 days, well inside the 91-day regulatory ceiling. Shorter generally means less sensitivity to interest rate movement and quicker portfolio turnover; slightly longer may capture marginally higher yield. There's no single correct number. What matters is that it's consistent with the fund's stated positioning and doesn't drift unexpectedly month to month.
Is a higher YTM on a liquid fund factsheet always better?
No. Yield to Maturity is an indicative figure based on the current portfolio, and within the same maturity band, a noticeably higher YTM usually reflects slightly lower-rated paper or greater issuer concentration rather than superior skill. Always read YTM alongside the rating profile and the holdings table, and remember your actual return is YTM minus the expense ratio, adjusted as securities mature and get reinvested at prevailing rates.
Can I compare two liquid fund factsheets from different AMCs directly?
Yes, and it's one of the most useful things you can do, provided you compare like for like. Make sure both factsheets are dated the same month-end, both refer to the same plan type (direct with direct, regular with regular), and both are actually categorised as Liquid Funds rather than Overnight or Ultra Short Duration. Then line up average maturity, modified duration, YTM, rating profile, PRC cell and expense ratio side by side.
Do I need to read a factsheet if I invest through an app or advisor?
You don't have to, but it's worth knowing what's in it. Even when a SEBI-Registered Investment Adviser or AMFI-registered distributor selects funds on your behalf, the mutual fund units are issued in your name by the AMC, so the underlying portfolio, costs and risks are ultimately yours. Reading a factsheet once or twice a year is a reasonable habit. It turns "someone chose this for me" into "I understand what I own".
Multipl is a AMFI registered Mutual Fund Distributor (ARN No. 319633).
*Based on historical returns of Liquid Fund category.
Disclaimer: Mutual Fund investments are subject to market risks, read all scheme related documents carefully.